This article is for health education purposes only and is for informational reference only; it does not constitute medical advice. If you have any health concerns, please consult a professional doctor.
Your physical examination report says "normal weight," yet in photos you look a full size heavier than your colleague. You and he might both weigh 60 kilograms—what differs is what those 60 kilograms are made of. The scale only measures total weight; it doesn't distinguish fat, muscle, and water—and the proportions of these three determine whether you wear an S or an L, and often determine which way the blood sugar and blood lipids on your lab report trend.
The "Report on the Nutrition and Chronic Disease Status of Chinese Residents (2020)" gives these figures: the overweight rate among Chinese adults is 34.3% and the obesity rate is 16.4%—meaning roughly one out of every two adults is overweight. But there is another group of people not captured in these two numbers who are even more worth watching: people whose weight number is normal but whose waist circumference is already over the limit. A study that followed 15,184 adults showed that men with normal weight but excess abdominal fat had an 87% higher risk of all-cause mortality than people of similar weight without abdominal fat (HR 1.87, 95% CI 1.53–2.29); for women the risk was 48% higher (HR 1.48) [1]. Normal weight does not equal normal metabolism.
✦ 1. The scale can't measure composition—it only measures total weight
On the same scale, a difference of one or two kilograms between morning and evening is very common; if you ate salty or high-carb food the day before, the number may jump the next day—most of that is water and glycogen fluctuating, not fat gained overnight. So when you weigh yourself, keep the conditions fixed: after waking and emptying your bladder, on the same scale, and look at the average of three weigh-ins per week rather than drawing conclusions from a single day's number.
✦ 2. Same 60 kilograms—where do two body types differ?
Let's do the math by body fat percentage. A person with 20% body fat: 12 kg of fat + 48 kg of fat-free mass (muscle, bone, organs, water). A person with 35% body fat: 21 kg of fat + 39 kg of fat-free mass. The two weigh the same, but their fat differs by 9 kg, and their muscle and other fat-free mass differs by 9 kg.
At the same weight, the volume of fat is about 1.18 times that of muscle (fat density is about 0.9 grams per milliliter, muscle about 1.06). So when those 9 kg are replaced by fat and mostly piled around the waist and abdomen, the visual difference is more than slight—the cut of your clothes is the first to notice.
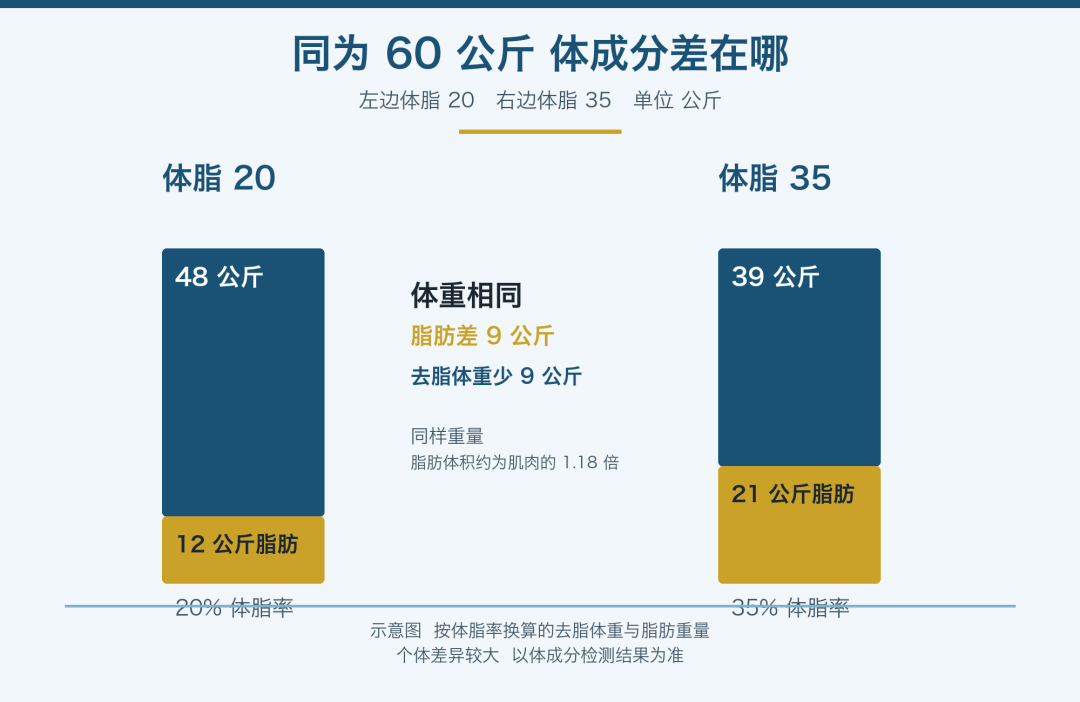
Caption: Both 60 kg—how much fat and fat-free mass does a person with 20% body fat versus 35% body fat have? Same weight, but composition can differ by 9 kg.
✦ 3. Two numbers more worth measuring than weight: waist circumference and waist-to-height ratio
Waist-to-height ratio = waist circumference ÷ height; 0.5 is generally considered a simple, easy-to-remember warning line. Under commonly used domestic standards, a waist circumference of 90 cm for men and 85 cm for women are also often used as cutoffs for abdominal obesity. A meta-analysis of 31 studies including more than 300,000 adults found that waist-to-height ratio identified 4% to 5% more people at risk for hypertension, diabetes, dyslipidemia, and cardiovascular risk than body mass index [2].
A cross-sectional study of 9,332 adults undergoing health checkups in Tianjin also suggested that for women, visceral fat area and waist-to-hip ratio predicted diabetes with discriminative power (AUC 0.743, 0.742) higher than body mass index (0.717) [5]. The measurement is simple: stand straight, wrap a tape measure horizontally around the upper edge of the navel, and don't suck in your stomach.
✦ 4. Are body fat scale numbers accurate?
Body fat scales use bioelectrical impedance analysis, estimating fat percentage via a weak electrical current. When four-electrode and eight-electrode home devices were compared with dual-energy X-ray absorptiometry (DXA), both showed good agreement with DXA, with the eight-electrode version matching better [3].
Its role is a "trend tool," not a lab report. To make it somewhat useful for reference, weigh at a fixed time (morning, fasted), on the same scale, and avoid weighing right after exercise or after drinking a lot of water; look at the trend over four weeks rather than obsessing over a single 1% fluctuation.
✦ 5. What you lose during weight loss may be muscle
This is often overlooked. A meta-analysis of 34 randomized controlled trials including 1,455 overweight or obese people showed that calorie restriction alone causes loss of both fat and fat-free mass; while "calorie restriction + exercise" preserved an average of 0.87 kg more fat-free mass than "calorie restriction alone," equivalent to offsetting about 45.7% of fat-free mass loss, with combined training showing a more pronounced effect, preserving 1.20 kg more [4].
Another meta-analysis of 20 randomized controlled trials in people over 50 similarly suggested that those who ate a higher proportion of protein during weight loss preserved more fat-free mass and lost more fat [6].
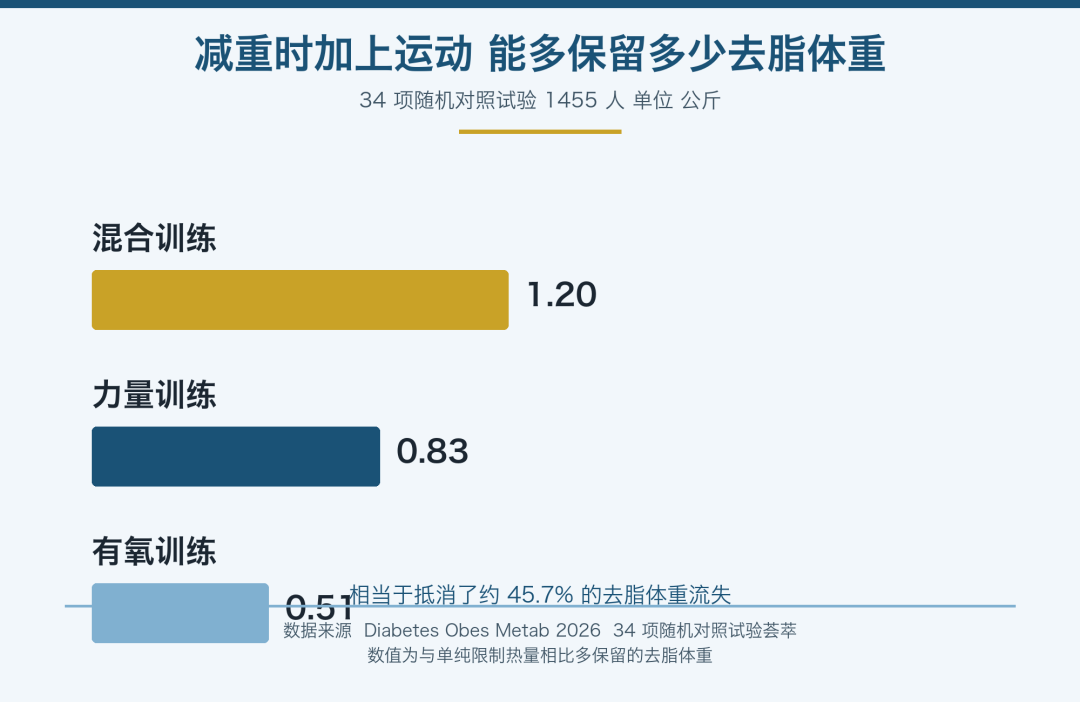
Caption: Across 34 randomized controlled trials, how much more fat-free mass can be preserved by adding exercise during weight loss—combined training about 1.20 kg, resistance training about 0.83 kg.
✦ 6. What body fat percentage is appropriate?
Commonly used reference ranges: 15% to 20% for men and 20% to 25% for women are considered healthy ranges; above 25% for men and above 30% for women, most institutions classify as excess body fat. Different measurement methods and populations will vary—looking at trends and waist circumference is more meaningful than chasing an absolute number.
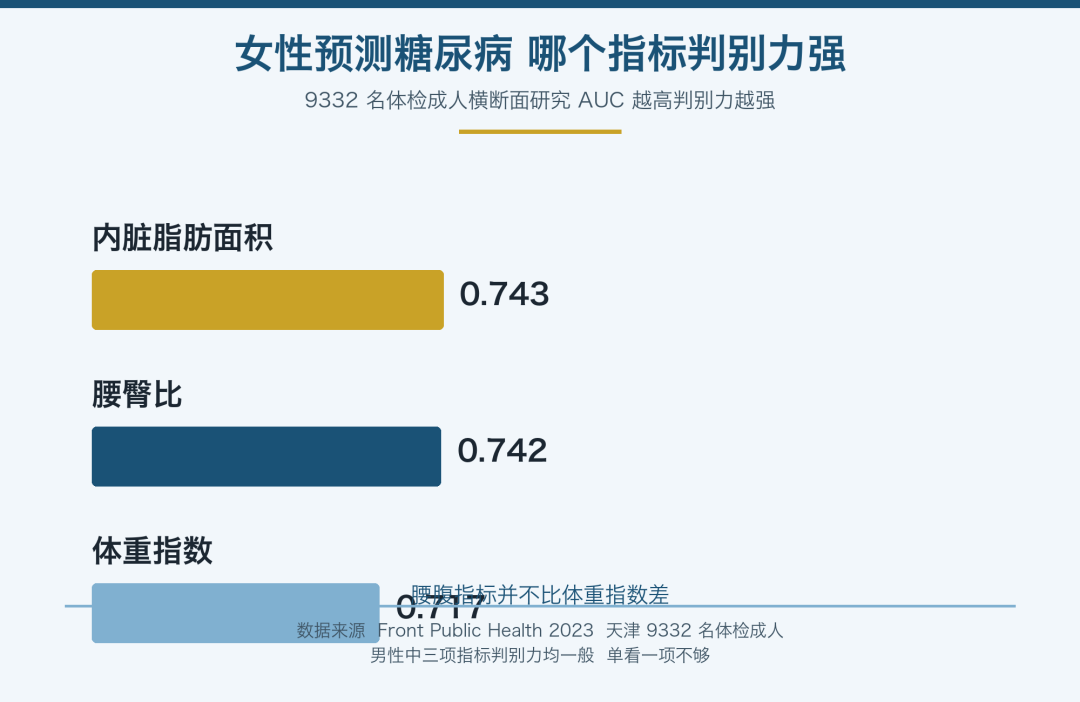
Caption: Comparison of the discriminative power of body mass index, waist-to-hip ratio, and visceral fat area in predicting diabetes in women—waist-abdomen indicators are no worse than body mass index.
✦ Four things you can do today
First, measure your waist circumference and height once, calculate your waist-to-height ratio, and write it down in a notebook. Second, fix the conditions for weighing yourself and average three weigh-ins per week. The "Dietary Guidelines for Chinese Residents (2022)" recommends resistance training at least 2 days per week—bodyweight moves like squats, push-ups, and resistance-band rows are enough to start. Third, put a palm-sized portion of protein food (fish, eggs, lean meat, soy products, milk) in every meal. Fourth, before bed, look less at your weight and more at the trend of your waist circumference.
In several situations, it's recommended to go directly to the hospital: waist circumference noticeably thickening in a short period, unintentional weight loss of more than 5% within half a year, lower limb edema, or obvious fatigue. These cannot be explained by adjusting your diet.
Weight is the result; body composition is the cause. Same 60 kilograms—whether you exercise or not, whether you get enough protein or not—a year later you'll have two different bodies.
If this was helpful to you, give it a like or a "Wow," and feel free to leave a comment telling us what topics you'd like to see. We also suggest forwarding it to that friend whose "weight is normal but whose pants keep getting tighter."
✦ Disclaimer: This article is for health education purposes only and is for informational reference only; it does not constitute medical advice. If you have any health concerns, please consult a professional doctor.
Conflict of interest statement: This article does not involve any product or brand recommendations and has no financial relationship with the research institutions mentioned in the text.
© 2026 Sun Shenghua (Beijing) Medical Technology Co., Ltd.
References
[1] Sahakyan KR, Somers VK, Rodriguez-Escudero JP, et al. Normal-Weight Central Obesity: Implications for Total and Cardiovascular Mortality. Ann Intern Med. 2015;163(11):827-835. PMID: 26551006
[2] Ashwell M, Gunn P, Gibson S. Waist-to-height ratio is a better screening tool than waist circumference and BMI for adult cardiometabolic risk factors: systematic review and meta-analysis. Obes Rev. 2012;13(3):275-286. PMID: 22106927
[3] Zhang Z, Lyu C, Zhu L. Assessment of the accuracy of bioelectrical impedance analysis for measuring body composition in adults based on dual-energy X-ray absorptiometry. J Clin Densitom. 2026;29(4):101736. PMID: 42501457
[4] Deller M, Weiershaus J, Held S, et al. Effects of Calorie Restriction With and Without Strength, Endurance or Mixed Training on Fat-Free and Skeletal Muscle Mass in Overweight or Obese Individuals: A Systematic Review With Pairwise Meta-Analysis and Network Meta-Analysis of Randomized Controlled Studies. Diabetes Obes Metab. 2026;28(8):6810-6823. PMID: 42144246
[5] He J, Zhang B, Fan Y, et al. Comparison of bioelectrical body and visceral fat indices and anthropometric measures in relation to type 2 diabetes by sex among Chinese adults, a cross-sectional study. Front Public Health. 2023;11:1001397. PMID: 38026280
[6] Kim JE, O'Connor LE, Sands LP, et al. Effects of dietary protein intake on body composition changes after weight loss in older adults: a systematic review and meta-analysis. Nutr Rev. 2016;74(3):210-224. PMID: 26883880